Two different ways to visualize data
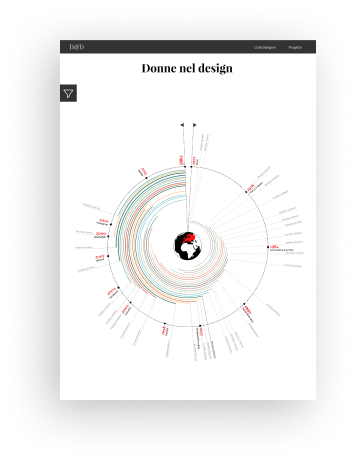
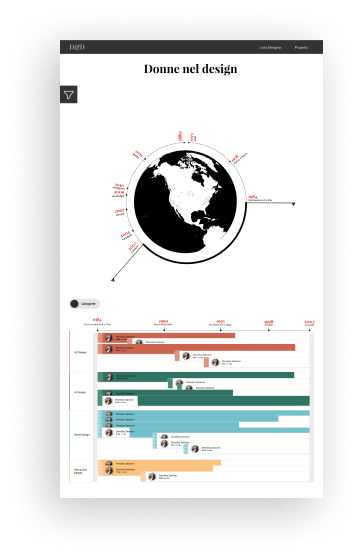
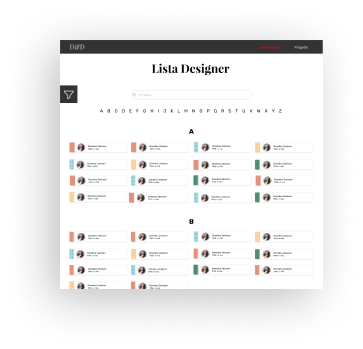
A typology of women's research is made through a graphic representation. Women are here as dots on the world and each of them is associated with the timeline of her life. The other type of data viewing is classic and sees all the women in an alphabetical list.A menu item has been dedicated to each of these visions.
Two filter level
Primary filter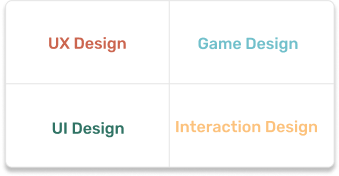
Secondary filter

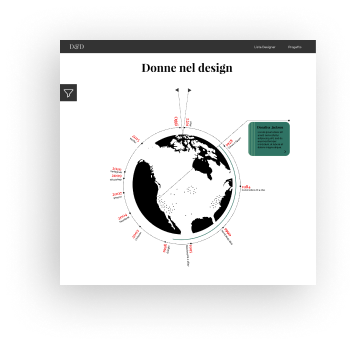
Spatial and temporal filter
The spatial filter allows to visualize all the women of a specific part of the world. Thanks to a radial bar chart, every woman is represented here with her time span. The temporal filter opens once the user selects a specific period of time. Here a more detailed view of the time opens and every woman is represented by a specific element.